Real-time data widgets
Set up widgets based on your specific needs and view real-time data from any connected device.
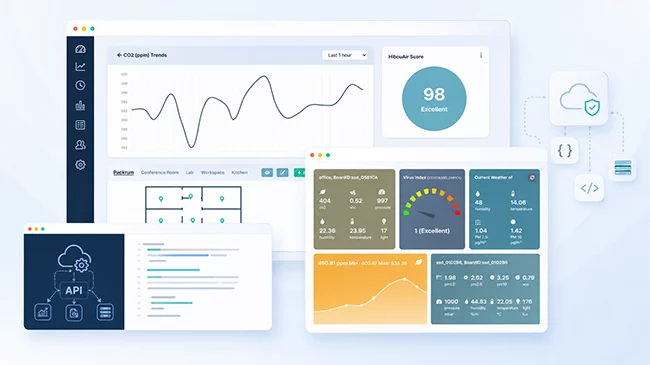
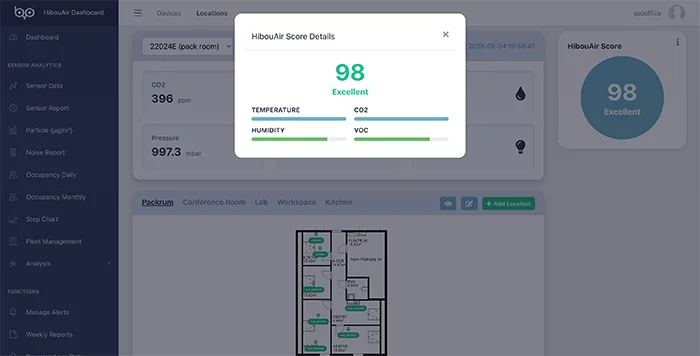
The HibouAir Smart Analytical Dashboard gives Cloud Enterprise and Cloud Lite users a clean web-based platform for monitoring indoor air quality. View live readings, 24-hour averages, weather widgets, Virus Index, sensor reports, comparison charts, alerts, fleet management, AI air quality scores, weekly reports, raw data and API access from one place.
 API
access
Sensor
reports
Real-time widgets
API
access
Sensor
reports
Real-time widgets
HibouAir is an advanced air quality monitoring solution designed to help you measure and understand your indoor environment. It monitors key environmental parameters such as CO2, particulate matter, temperature, humidity, pressure, VOC and more. The Smart Analytical Dashboard turns this data into clear visual insight for teams that need continuous monitoring and practical reporting.
Set up widgets based on your specific needs and view real-time data from any connected device.
Check daily average values to understand how air quality changes throughout the day.
Add current weather widgets for a selected location and compare indoor and outdoor air quality side by side.
View a real-time indication of virus transmission risk level, including an explanation of what the score means.
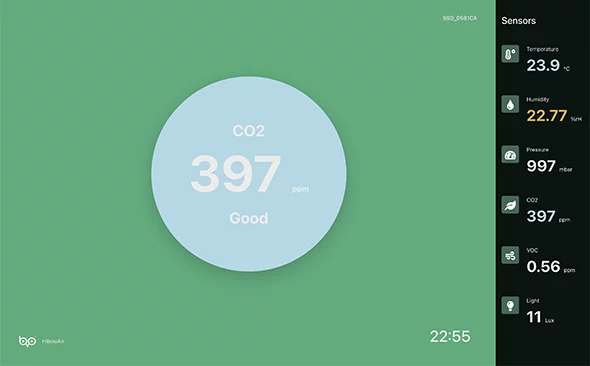
Open widgets in full-screen mode and keep them running continuously with automatic data updates every minute.
Select a device and sensor to view data over a chosen time frame or by date.
Compare multiple devices and environmental parameters at once for deeper analysis.
Export datasets with a single click for reporting, deeper analysis or integration with your own system.
Analyze particulate matter values alongside environmental factors such as humidity.
If your setup includes a HibouAir noise sensor, noise data can be accessed and compared with other parameters.
Use daily and monthly average CO2 heat maps to understand occupancy patterns and longer-term room usage trends.
Set a sensor range and visualize how often values exceed your chosen limit for compliance and safety monitoring.
View real-time readings, 24-hour averages and selected weather widgets from one clean dashboard.
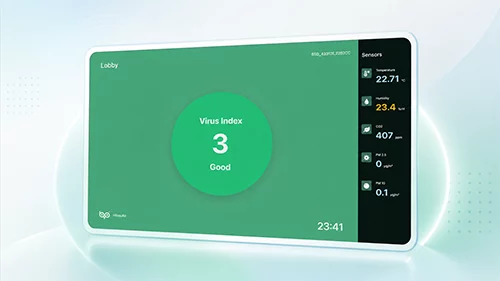
Display real-time virus transmission risk level and explain what the score means for the indoor environment.
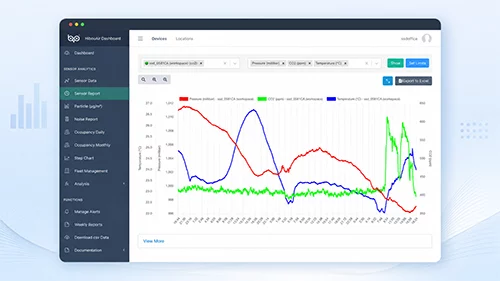
Choose device, sensor and time period to analyze data by date, hourly interval or selected time range.
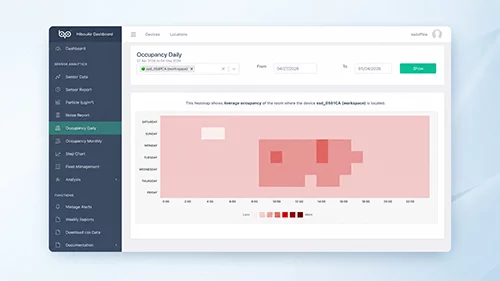
Visualize daily and monthly average CO2 levels to understand occupancy patterns and room usage.
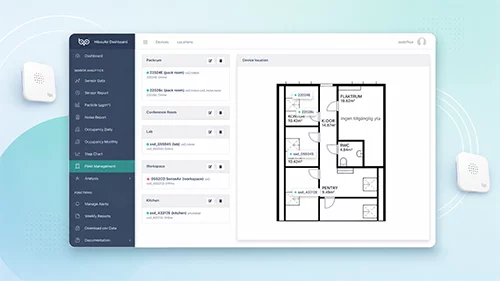
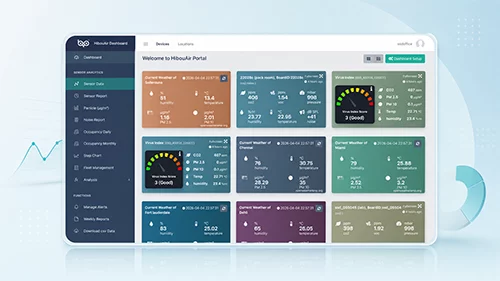
Monitor multiple devices across rooms, offices and locations from a single platform.
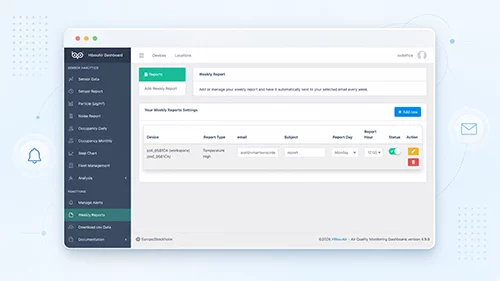
Set threshold-based alerts and receive weekly summaries automatically by email.
See how the HibouAir Smart Analytical Dashboard displays real-time widgets, 24-hour averages, Virus Index, sensor reports, comparison tools, heat maps, alerts, fleet management and API access.
HibouAir fleet management allows you to monitor multiple devices across different locations from a single platform. If devices are installed in various offices or rooms, you can view them under one location, manage devices, add new ones and review detailed room-level insights.
Set threshold values for any device and parameter. When thresholds are exceeded, HibouAir sends alert notifications to your registered email address.
Automatically receive selected device summaries by email so your team stays informed without daily login.
Download raw data for custom analysis or use the documented API to connect HibouAir data with your own dashboard or third-party system.
Track air quality trends across meeting rooms, open offices and shared spaces.
Support classroom monitoring with clear live views, reports and alerts.
Manage devices by location and respond faster when thresholds are exceeded.
Export datasets and review historical measurements for deeper analysis.
Monitor rooms and common spaces with cloud-based visibility for responsible teams.
Use historical charts, heat maps and reports to support assessment work.
Talk to Smart Sensor Devices about Cloud Enterprise or Cloud Lite and find the right monitoring setup for your building, organization or research project.